2010–11 Season Recap
April 15, 2011
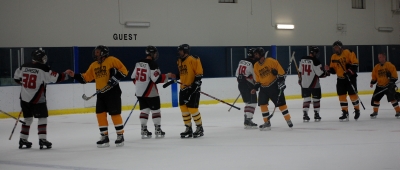
In the team’s sixth full AHA Winter season, and fourth at level D1, the Spiders finished the regular season with an undefeated 19–0–1 record (39 of 40 possible points), in first place in D1 West, and best overall record in the AHA.
The Spiders also made their third consecutive post-season appearance in D1, where they went went 3–2 (6 points), suffering their first loss of the season to the Diablos in the final round-robin game, and their second — and last — loss of the season to the Lumberjacks in the D1 Championship game.
This was the team’s fourth winning season, with 2009–10, 2008–09’s D1 Champion squad and 2006–07 representing the others.
- Regular season standings: 19–0–1, with 39 points.
- Post-season standings: 3–2–0, with 6 points.
- Full season standings: 22–2–1, with 45 points.
As is the Spiders’ club tradition, like last year’s season recap, here are the season’s notes and numbers:
Note: Although the Spiders saw post-season action this year, this recap focuses on the regular season, with playoff stats indicated in italics.
Team stat highlights
Goal stats
- Most goals for:
- 11, vs. Chaos (12/20/2010)
- Fewest goals for:
- 2 (regular season), vs. Puck Hounds (1/30/2011)
[1 (post-season), vs. Diablos (4/9/2011), and vs. Lumberjacks (4/10/2011)] - Most goals for in loss:
- No losses (regular season)
[1 (post-season), vs. Diablos (4/9/2011), and vs. Lumberjacks (4/10/2011)] - Fewest goals for in win:
- 3 (regular season), vs. Gold Rush (3/13/2011)
[2+shootout (post-season), vs. Northern Horde (4/9/2011)] - Most goals against:
- 5, vs. Fighting Saints (11/6/2010)
- Fewest goals against:
- 0, vs. Puck Hounds (1/30/2011)
- Most goals for in a period:
- 5 (twice), vs. Gold Rush (third period; 11/29/2010) and vs. Chaos (second period, 12/20/2010)
- Most goals against in a period:
- 3 (twice; regular season), vs. Fighting Saints (second period; 11/6/2010) and vs. Fighting Saints
- 3 (third period; 1/2/2011); [(3; post-peason), vs. Lumberjacks (first period, 4/10/2011)]
- Most Power-Play goals for:
- 2, vs. Puck Hounds (3/20/2011)
- Most Power-Play goals allowed:
- 1 (twice), vs. Chaos (10/24/2010) and (12/20/2010)
[2 (post-season), vs. Wingmen (4/8/2011)] - Most short-handed goals for:
- 1 (twice), vs. Royals (3/6/2011) and vs. Gold Rush (3/13/2011)
- Most short-handed goals allowed:
- 2, vs. Maroons (12/18/2010)
- Number of games where opponent scored first:
- 5 (plus 4 in post-season)
- Number of games where opponent scored first and Spiders won game:
- 5, vs. Maroons (12/18/2010); vs. Ice Gators (1/9/2011); vs. Ice Gators (3/4/2011); vs. Royals (3/6/2011); and vs. Gold Rush (3/13/2011)
[Post-season: 2, vs. Wingmen (4/8/2011); and vs. Northern Horde (4/9/2011)] - Number of games where Spiders scored first and Spiders lost game:
- 0
- Number of games where Spiders scored first and game ended in tie:
- 0
- Number of games where opponent scored first and game ended in tie:
- 1, vs. Puck Hounds (3/20/2011)
- Average number of goals allowed before Spiders’ first goal in games where opponent scored first:
- 1.2, among five games (2 in post-season, among four games; 1.5 in total, among nine games)
- Quickest first Spiders’ goal:
- At 16:29, 31 seconds into first period, vs. Ice Gators (11/14/2010), by Chris Flannery.
- Latest first Spiders’ goal:
- At 10:42 of second period, vs. Puck Hounds (1/30/2011), by Cody Yard.
[At 4:46 of third period, vs. Diablos (4/9/2011), by Eric Grotbeck.] - Latest first goal in a win:
- 10:42 of second period, vs. Puck Hounds (1/30/2011), by Cody Yard.
[15:04 of third period, vs. Wingmen (4/8/2011), by Jason Freed.] - Quickest first opponent goal:
- At 16:05, 55 seconds into first period, vs. Royals (3/6/2011)
[At 15:24, 1:36 into first period, vs. Diablos (4/9/2011)] - Latest first opponent goal (not including shutouts):
- At 8:18, 8:42 into third period, vs. Fighting Saints (1/2/2011)
- Highest number of goals allowed before Spiders scored:
- 2, vs. Royals (3/6/2011)
[4, vs. Lumberjacks (4/10/2011)]
Results stats
- Wins with one-goal margin:
- 6 (plus two more in playoffs)
- Wins with two-goal margin:
- 3
- Wins with three-goal margin:
- 2
- Wins with four-goal margin:
- 1 (plus one more in playoffs)
- Wins with five-goal or more margin:
- 7
- Losses with one-goal margin:
- 0 (1 in playoffs)
- Losses with three-goal margin:
- 0 (1 in championship)
Shots stats
Note: Due to the AHA scorekeeping policy change for this season, shots-by-period stats are only partially accurate, and therefore will not be included in this recap.
- Most shots for:
- 53, vs. Ice Gators (3/4/2011)
- Fewest shots for:
- 23, vs. Ice Gators (1/9/2011)
- Most shots for in loss:
- 42, vs. Diablos (4/9/2011) (new team record)
- Fewest shots for in win:
- 23, vs. Ice Gators (1/9/2011)
- Most shots against:
- 32 (twice), vs. Chaos (10/24/2010) and vs. Ice Gators (1/9/2011)
- Fewest shots against:
- 13 (twice), vs. Fighting Saints (11/6/2010) and vs. Chaos (12/20/2010)
- Most shots against in win:
- 32 (tied), vs. Chaos (10/24/2010), and vs. Ice Gators (1/9/2011)
- Fewest shots against in loss:
- 16, vs. Diablos (4/9/2011) (new team record)
- Highest shots-to-goals percentage:
- 32.1% (9 goals on 28 shots), vs. Royals (3/6/2011)
- Lowest shots-to-goals percentage (in non-shutout):
- 7.5% (3 goal on 40 shots), vs. Gold Rush (3/13/2011) [in playoffs: 2.38% (1 goal on 42 shots), vs. Diablos (4/9/2011)]
Penalty stats
- Most penalties by Spiders in game:
- 6, vs. Fighting Saints (12 PIM; 11/6/2010)
- Most PIMs by Spiders in game:
- 18 PIM, vs. Fighting Saints (on 4 penalties; 1/2/2011)
- Most penalties by opponent in game:
- 6 (twice), vs. Fighting Saints (12 PIM; 11/6/2010); vs. Maroons (12 PIM; 2/13/2011)
- Most PIMs by opponent in game:
- 12 PIM, vs. Fighting Saints (on 6 penalties; 11/6/2010); vs. Maroons (on 6 penalties; 2/13/2011)
- Most penalties in game (both teams combined):
- 12, vs. Fighting Saints (24 PIM; 11/6/2010)
- Most PIMs in game (both teams combined):
- 24 PIM, vs. Fighting Saints (on 12 penalties; 11/6/2010)
- Number of games where Spiders had no penalties:
- 0
- Number of games where opponent had no penalties:
- 1, vs. Gold Rush (11/29/2010)
- Number of games where Spiders had more penalties than opponent:
- 3
- Number of games where Spiders had fewer penalties than opponent:
- 7 (plus three more in playoffs)
- Number of games where Spiders and opponent had equal penalties:
- 10 (plus one more in playoffs)
- Most frequently called penalty (including opponent penalties):
- Tripping (called 33 times; plus at least 12 more times in the playoffs)
- Most frequently called penalty (on Spiders):
- 15 times, for tripping (plus at least 2 more times in the playoffs)
(The rest: Hooking – 8; Roughing, Cross-checking and Holding – 6; Interference – 5; Checking and high-sticking – 3; Cross-checking – 2; Slashing, too many men, unsportsmanlike conduct – 2) - Most frequently called penalty (on opponents):
- 19 times, for tripping (plus at least 9 more times in the playoffs)
(The rest: Roughing – 9; Checking and Slashing – 8; Hooking – 7; High-Sticking and Interference – 5; Cross-checking, Holding, Holding the stick, unsportsmanlike conduct – 1)
Bench stats
- Largest roster:
- 16 skaters (three times), vs. Chaos (10/24/2010), vs. Puck Hounds (1/30/2011), vs. Royals (3/6/2011)
[17 skaters, vs. Diablos (4/9/2011)] - Shortest roster:
- 10 skaters (twice), vs. Fighting Saints 2/26/2011), vs. Puck Hounds (3/26/2011)
- Largest opponent roster:
- 17, vs. Puck Hounds (1/30/2011)
- Shortest opponent roster:
- 11, vs. Chaos (2/19/2011)
- Average Spiders roster:
- 13.4 skaters (Playoffs: 16.4 skaters)
- Average opponent roster:
- 14.0 skaters (Playoffs: 15.25 skaters*)
- Largest negative roster differential:
- -4 skaters (twice), vs. Maroons (2/13/2011; 16 skaters–12 skaters) and vs. Fighting Saints (2/26/2011; 14 skaters–10 skaters)
- Largest positive roster differential:
- +2 skaters (twice), vs. Chaos (10/24/2010; 16 skaters–14 skaters), vs. Royals (3/6/2011; 16–14) [plus once in playoffs, vs. Diablos (4/9/2011)]
- Average roster differential:
- -0.7 skaters
Arena stats
- Largest dressing rooom:
- The “small” room at New Hope, with only 11 bodies (3/26/2011)
- Coziest dressing room:
- Standing room only at BIG 3 (4/8/2011 and 4/9/2011)
- Most inconvenient dressing room:
- BIG 1, next to the D1 Champions Lumberjacks (4/10/2011)
- Most improved dressing room facilities:
- Coliseum, now with real benches instead of folding chairs and livestock stalls
- Lousiest ice:
- BIG 3 (4/9/2011 vs. Northern Horde)
- Number of games played on Olympic ice (200′x100′):
- 5
- Number of wins in games played on Olympic ice:
- 5
- Most items left in a room after a game:
- BIG 3 (Schuster’s glove, Heitzman’s bottle, Droullard’s bottle, Pettengill’s bottle, Johnson’s breezers, Wahlberg’s sock, Cison’s skate bolt)
Player stat higlights
Scoring
- Most goals:
- 25, Jake Cison [plus 1 in playoffs; total: 26]
- Most assists:
- 22, Jake Cison [plus 1 in playoffs; total: 23]
- Most first assists:
- 18, Jake Cison [plus 1 in playoffs; total: 29]
- Most second assists:
- 5 (tied), Chris Pettengill and Mike Schroeder
- Most points:
- 47, Jake Cison [plus two more in playoffs; total: 49]
- Most goals per game:
- 4, Chris Flannery (2/13/2011 vs. Maroons)
- Highest average goals per game played:
- 1.32, Jake Cison (25 goals in 19 games)
- Most assists per game:
- 4 (tied), Jake Cison vs. Chaos (12/20/2010) and vs. Royals (3/6/2011)
- Highest average assists per game played:
- 1.16, Jake Cison (22 assists in 19 games)
- Most points per game:
- 6 (three times), Jake Cison vs. Chaos (12/20/2010), vs. Fighting Saints (2/26/2011), vs. Royals (3/6/2011)
- Highest average points per game played:
- 2.47, Jake Cison (47 points in 19 games)
- Most power-play goals (season):
- 3, Jake Cison
- Most short-handed goals (season):
- 2, Christian Heitzman
- Most game-winning goals:
- 4, Cody Yard
- Most assisted goals:
- 21, Jake Cison
- Most unassisted goals:
- 4, Jake “Puck Hog” Cison
- Most frequent scoring combos:
- 29 goals, the line of Jake Cison, Cody Yard, Cory Vandenberghe
- Most shootout goals:
- 1 (tied), Cody Yard, Jake Cison
Penalties
- Most PIM:
- Regular season: 22, Chris Flannery (on 6 penalties) (plus at least four more PIM in post-season)
- Most penalties (quantity):
- 6 (tied), Chris Flannery (22 PIM) and Chris Pettengill (14 PIM)
[Including post-season: 8, Chris Flannery (26 PIM)] - Most PIM per game:
- 14, Chris Flannery (1/2/2011)
- Most penalties per game:
- 2 (tied), Chris Flannery (1/2/2011), Christian Heitzman (11/6/2010), Chris Pettengill (11/21/2010), Eric Schlais (2/26/2011), Jeremy Litton (3/13/2011)
[Including playoffs: 2, Chris Flannery (4/5/2011), and Chris Pettengill (4/9/2011)] - Highest average PIM per game played:
- 1.47 per game, Chris Flannery (closely followed by Chris Pettengill, 1.08; then Cory Vandenberghe, 0.67; and Eric Schlais, 0.62)
- Most misconducts:
- 0!
- Most retroactively assessed (i.e., post-game) misconducts:
- 0!
- Most penalties leading to opponent goals (season):
- 1 (tied), Eric Grotbeck and Cody Yard
[including playoffs: 1, Chris Flannery, Eric Schlais, Mike Schroeder] - Most offsetting (even-strength) penalties (season):
- 1 (tied), Cody Yard (3/4/2011), Tim Wahlberg (3/26/2011)
[Including playoffs: 2, Chris Flannery] - Fewest penalties:
- 0, Brad Caron, Travis Fransen, Jason Freed, Mike Johnson, John Pellicci
Duly noted: Longtime cooler dweller and perennial “LaCosse Award” winner for most penalties, Paul LaCosse was remarkably absent from the PIM column in the regular season. While he did get called for just one lone hooking call vs. the Royals, the scorekeeper misentered the stat, meaning in the eyes of the league, LaCosse remained scot-free, thus eligible for the AHA’s Lady Bing trophy at regular season’s end.
Goaltending
- Most saves per game:
- 30, Travis Fransen (1/9/2011, vs. Ice Gators)
- Fewest saves per game:
- 8, Travis Fransen (11/6/2010, vs. Fighting Saints)
- Most saves per game in tie:
- 26, Travis Fransen (3/20/2011, vs. Puck Hounds)
- Fewest saves per game in win:
- 8, Travis Fransen (11/6/2010, vs. Fighting Saints)
- Most saves per game in win:
- 30, Travis Fransen (1/9/2011, vs. Ice Gators)
- Fewest saves per game in loss:
- 14, Travis Fransen (4/9/2011, vs. Diablos)
- Most shutouts in season:
- 1, Travis Fransen (1/30/2011, vs. Puck Hounds) [plus one more in playoffs, vs. Chaos (4/5/2011)]
- Highest goals against average (for non-sub, but non-full-time goalie):
- 2.00, Cody Yard
Attendance
- Most games played:
- 19, Eric Grotbeck and Jake Cison [plus 5 more in playoffs; total: 24]
- Most on-ice season-ending injuries:
- 0 (regular season)! [2 (post-season)]
- Most off-ice season-almost-ending procedures:
- 2, David Schuster
- Number of games (GP per player, per game) missed due to suspension:
- 0!
- Largest audience:
- 90, BIG 3 (4/10/2011)
TSN’s ‘Spider Firsts’:
In an unprecedented season, a look at “firsts” in the Spiders franchise:
- First undefeated regular season
- First loss in a championship game (4/10/2011)
- First time beating the Chaos (10/24/2010)
- First time both teams dressed in away uniforms in a game (vs. Ice Gators, 11/14/2010).
- First time the Spiders have faced a former Spiders goalie (3/6/2011 and 4/8/2011).
- First time the Spiders participated in a shootout (4/9/2011).
- First time since 2005 ahaspiders.com has not been able to provide game stats on time (due to AHA policy change to no longer supply paper scoresheets).
- First time the Spiders allowed more shorthanded goals (3) than power play goals (2) in regular season (and one of the power play goals was a 5-on-3).
- First time Paul LaCosse was not a contender for most penalties.
- First time the Spiders did not lead their playoff pool in average PIM per game played.
- First complete somersault following cross-check (3/26/2011).
D1 West leader board – regular season (Spiders)
Point leaders
- Jake Cison
- #1 (listed at 43, but actual total was 47)
- Cody Yard
- #3 (listed at 31, but actual total was 32)
- Chris Flannery
- #9 (listed at 22, but actual total was 23; so a tie for #8 with B. Vesall)
- Christian Heitzman
- #13 (19 points)
Goal-scoring leaders
- Jake Cison
- #1 (listed at 24, but actual total was 25)
- Chris Flannery
- #4, 16 goals
- Cody Yard
- #5, 15 goals
- Mike Johnson
- #13 (2-way tie), 10 goals
- Cory Vandenberghe
- #13 (2-way tie), 10 goals
Assist leaders
- Jake Cison
- #2 (listed at 19 assists, but actual total was 22; so #1 slot)
- Cody Yard
- #3 (tie; listed at 16, but actual total was 17; so #3 slot)
- Jeremy Litton
- #6 (tie), 12 assists
- David Schuster
- #13 (listed at 10 assists, but actual total was 11; so three-way tie for #8 slot)
Penalty minute leaders
- Chris Flannery:
- #3, 22 PIM
Goalie Stats
- Travis Fransen
-
- #1– Wins (17)
- #2 (four-way tie) – Shutouts (1)
- #2– Sv% (0.900)
- #1 – GAA (2.39)
- #3 – GA (43; #1 among full-time goalies)
AHA overall leader board
Point leaders
- Jake Cison
- #5 (listed at 43, but actual total was 47; so tied for #1)
Goal-scoring leaders
- Jake Cison
- #12 (listed at 24, but actual total was 25; so four-way tie for #9)
Assist leaders
- Jake Cison
- #12 (listed at 19 assists, but actual total was 22; so #3)
D1 West leader board – including post-season (Spiders)
Point leaders
- Jake Cison
- #1 (listed at 45, but actual total was 49)
- Cody Yard
- #3 (listed at 33, but actual total was 34)
- Chris Flannery
- #6 (three-way tie; listed at 24, but actual total was 25; so #5)
- Christian Heitzman and Cory Vandenberghe
- #13 (2-way tie) (20 points)
Goal-scoring leaders
- Jake Cison
- #1 (listed at 25, but actual total was 26)
- Chris Flannery
- #4, 16 goals
- Cody Yard
- #5, 16 goals
- Mike Johnson
- #13 (3-way tie; listed at 11 goals, but actual total was 12, so 4-way tie for #8)
Assist leaders
- Jake Cison
- #2 (listed at 20 assists, but actual total was 23; so #1)
- Cody Yard
- #3 (tie; listed at 17, but actual total was 18)
- Jeremy Litton
- #5, 14 assists
- Rob Droullard
- #9 (4-way tie), 11 assists
- David Schuster
- #13 (listed at 10 assists, but actual total was 11; so 5-way tie for #9)
Penalty minute leaders
- Chris Flannery:
- #2, 28 PIM
Goalie Stats
- Travis Fransen
-
- #1– Wins (20)
- #1 (two-way tie) – Shutouts (2)
- #2 – Sv% (0.901)
- #1 – GAA (2.23)
Note: Stats do not include game #25.
AHA overall leader board (including post-season)
Point leaders
- Jake Cison
- #5 (listed at 45, but actual total was 47; so #4)
Goal-scoring leaders
- Jake Cison
- #12 (listed at 25, but actual total was 26; so four-way tie for #9)
Assist leaders
- Jake Cison
- #12 (listed at 20 assists, but actual total was 23; so tied for #3)
Goalie Stats
- Travis Fransen
- #10 GAA (2.23)